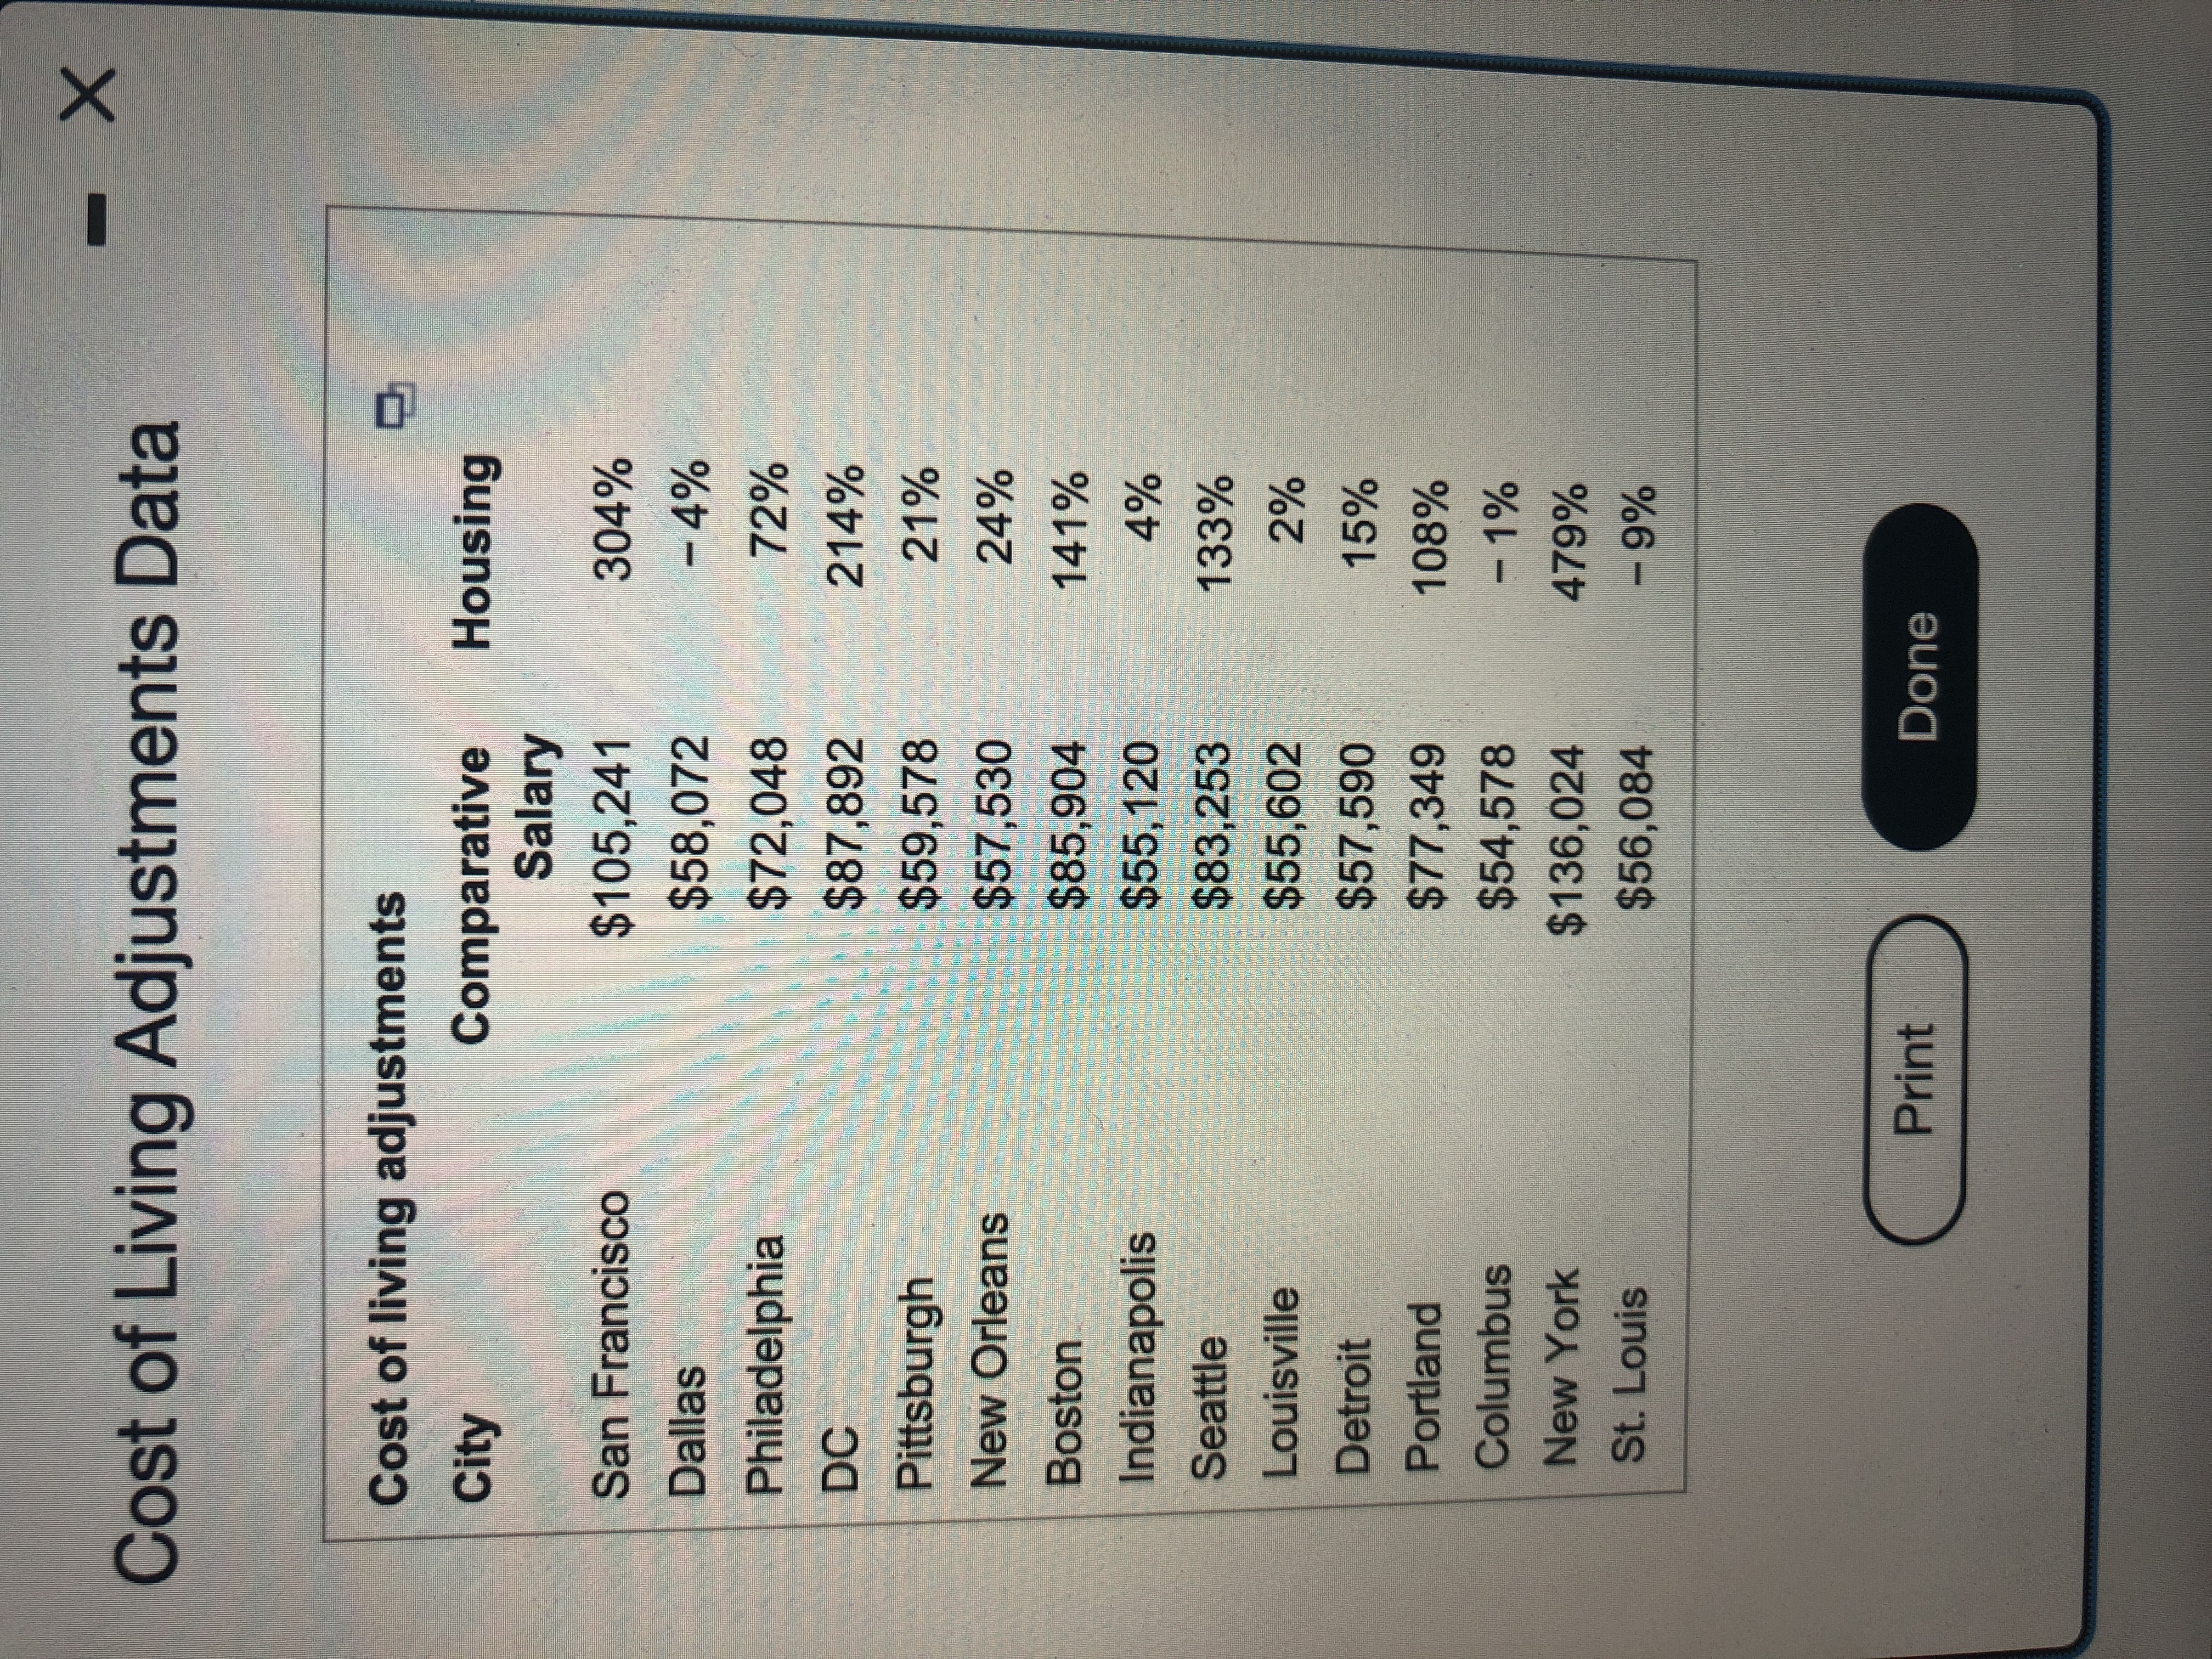
Compute the mean and standard deviation of the provided sample data on cost of living adjustments. Then compute the z-scores for the smallest and largest comparative salaries and housing adjustments and interpret your results.
"The z-scores show that the comparative salary amount for __ (St. Louis/New York/Columbus) is the farthest away from the __ (variance/standard deviation/mean) comparative salary amount. The z-scores also show that the housing amount for ___(St. Louis/New York/Columbus) is the fate these away from the ___ (variance/standard deviation/mean)."

Extracted text: %24 %24 %24 Calculate the mean and standard deviation for the comparative salary and housing columns. (Round to two decimal places as needed.) Housing Comparative Salary Mean Standard Deviation Find the largest and smallest comparative salary amounts and calculate the z-scores for these amounts. (Round to two decimal places as needed.) City Comparative Salary Z-Scores Columbus $54,578 New York $136,024 Calculate the Z-scores for the largest and smallest housing percentages. (Round to two decimal places as needed.) City Housing Z-Scores St. Louis %6 - 479% New York APR 23 国一 08 F3 esc F2 F4 F5 %23 $4

Extracted text: Cost of Living Adjustments Data X - Cost of living adjustments Comparative Salary City Housing San Francisco $105,241 304% Dallas $58,072 Philadelphia $72,048 72% DC $87,892 214% Pittsburgh %2459,578 21% New Orleans $57,530 24% Boston $85,904 141% Indianapolis $55,120 4% Seattle %2483,253 133% Louisville $55,602 2% Detroit $57,590 15% Portland $77,349 108% Columbus $54,578 - 1% New York $136,024 479% St. Louis %2456,084 Print Done