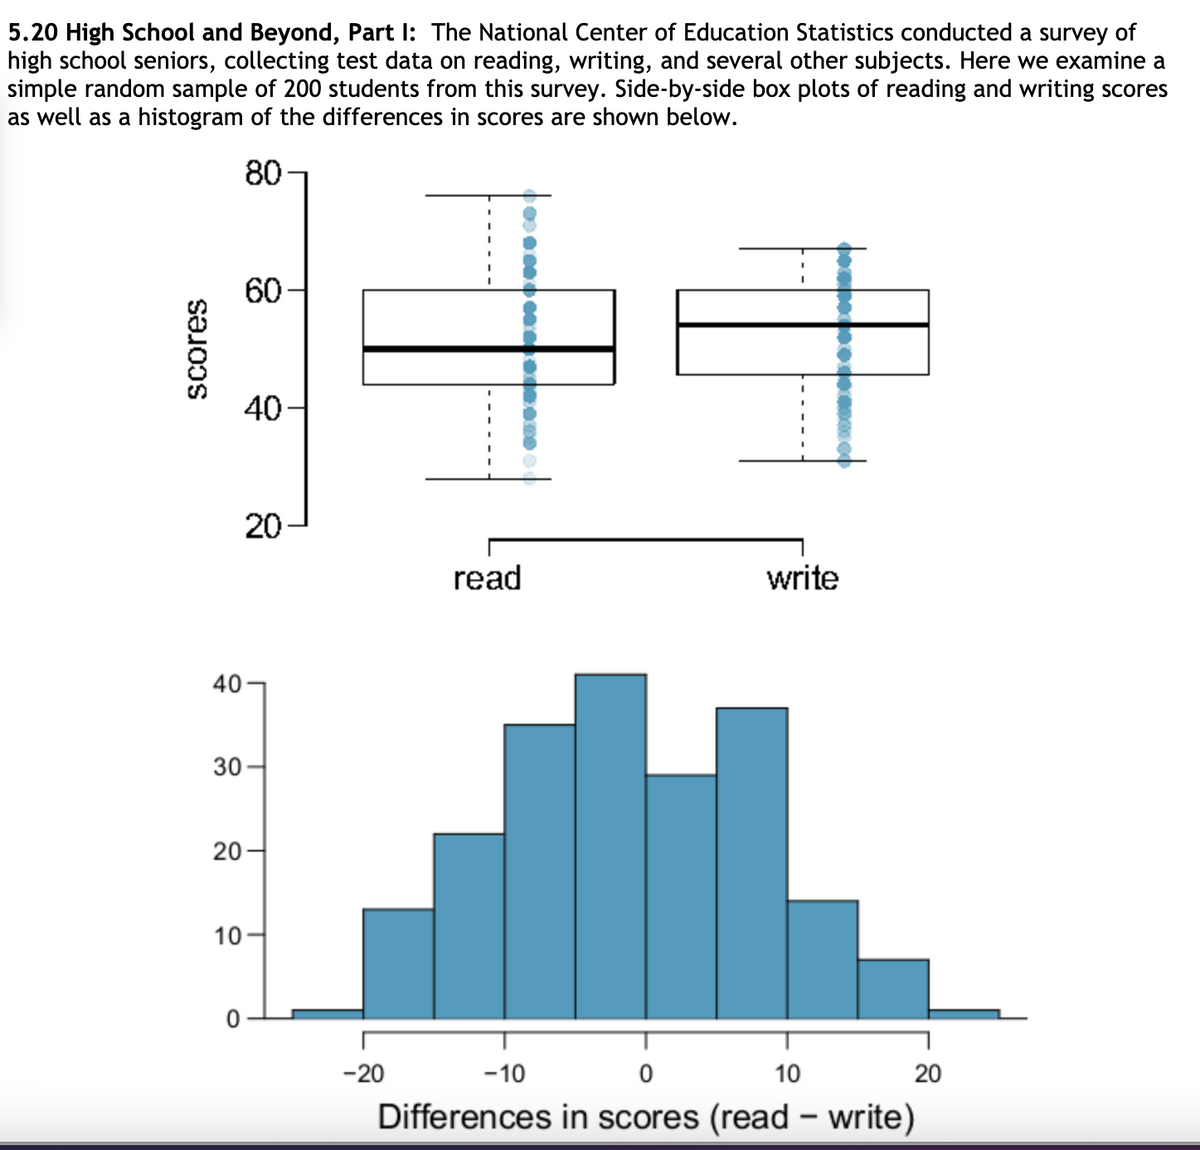
5.20 High School and Beyond, Part I: The National Center of Education Statistics conducted a survey of high school seniors, collecting test data on reading, writing, and several other subjects. Here we examine a simple random sample of 200 students from this survey. Side-by-side box plots of reading and writing scores as well as a histogram of the differences in scores are shown below.
(a) Are the reading and writing scores of each student independent of each other?
- ( )yes, they are paired since each student has both a reading score and a writing score
- ( )no, they are paired since each student has both a reading score and a writing score
- ( ) yes, because reading and writing are two different activities
(b) Create hypotheses appropriate for the following research question: is there an evident difference in the average scores of students in the reading and writing exam?
- ( )Ho: μdiff = 0
Ha: μdiff <>
- ( )Ho: μdiff = 0
Ha: μdiff > 0
- ( )Ho: μdiff = 0
Ha: μdiff ≠ 0
(c) The average observed difference in scores is �x̄read - write = ?-0.545, and the standard deviation of the differences is 8.887 points. Do these data provide convincing evidence of a difference between the average scores on the two exams?
The test statistic is: _________
(please round to two decimal places)
The p-value is: ___________
(please round to four decimal places)
The conclusion of the test is:
- ( )Since p ≥ α we accept the null hypothesis
- ( )Since p ≥ α we reject the null hypothesis and accept the alternative
- ( )Since p ≥ α we do not have enough evidence to reject the null hypothesis
- ( )Since p<α we="" fail="" to="" reject="" the="" null="">
- ( )Since p<α we="" reject="" the="" null="" hypothesis="" and="" accept="" the="">

Extracted text: 5.20 High School and Beyond, Part I: The National Center of Education Statistics conducted a survey of high school seniors, collecting test data on reading, writing, and several other subjects. Here we examine a simple random sample of 200 students from this survey. Side-by-side box plots of reading and writing scores as well as a histogram of the differences in scores are shown below. 80 60- 40 20 read write 40 – 30 20- 10 -20 -10 10 20 Differences in scores (read– write) Scores