please use the information from both pages to answer number 20

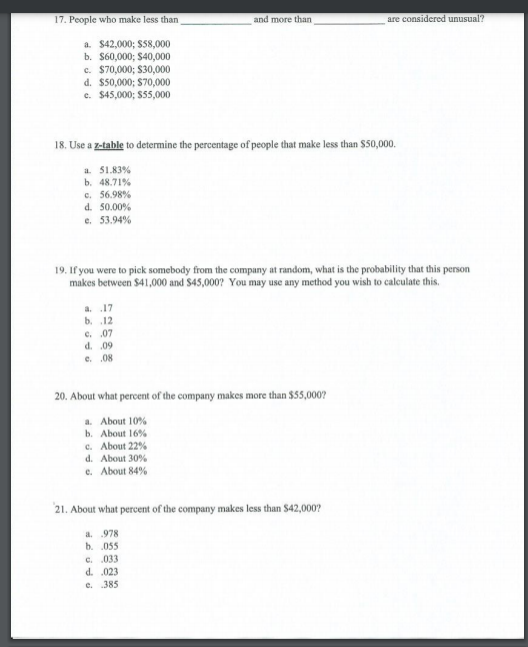
Extracted text: 17. People who make less than and more than are considered unusual? a. $42,000; $58,000 b. $60,000; $40,000 c. $70,000; $30,000 d. $50,000; S70,000 c. $45,000; $55,000 18. Use a z-table to determine the percentage of people that make less than $50,000. a. 51.83% b. 48.71% c. 56.98% d. 50.00% e. 53.94% 19. If you were to pick somebody from the company at random, what is the probability that this person makes between $41,000 and $45,000? You may use any method you wish to calculate this. a. 17 b. 12 C. 07 d. .09 e. 08 20. About what percent of the company makes more than $55,000? a. About 10% b. About 16% c. About 22% d. About 30% e. About 84% 21. About what percent of the company makes less than $42,000? a. 978 b. 055 c. .033 d. .023 e. 385

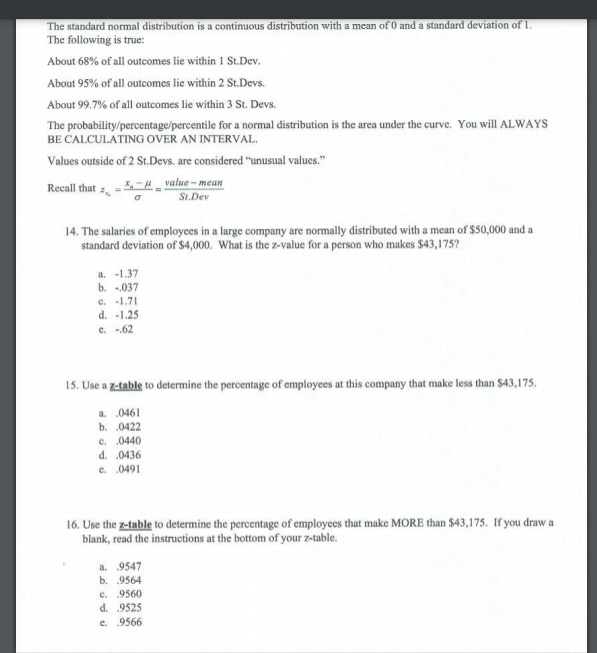
Extracted text: The standard normal distribution is a continuous distribution with a mean of 0 and a standard deviation of 1. The following is true: About 68% of all outcomes lie within 1 St.Dev. About 95% of all outocomes lie within 2 St.Devs. About 99.7% of all outcomes lie within 3 St. Devs. The probability/percentage/percentile for a normal distribution is the area under the curve. You will ALWAYS BE CALCULATING OVER AN INTERVAL. Values outside of 2 St.Devs. are considered "unusual values." Recall that -H _ value – mean SI.Dev salaries of employees in a large company are normally distributed with a mean of $50,000 and a standard deviation of $4,000. What is the z-value for a person who makes $43,175? 14. a. -1.37 b. -.037 e. -1.71 d. -1.25 c. 62 15. Use a z-table to determine the percentage of employees at this company that make less than $43,175. a. 0461 b. 0422 c. .0440 d. 0436 e. 0491 16. Use the z-table to determine the percentage of employees that make MORE than $43,175. If you draw a blank, read the instructions at the bottom of your z-table. a. 9547 b. 9564 c. 9560 d. 9525 e. 9566